LAB 3: COMPUTER GRAPHICS AND POLYGONS
Mathematics:
When
a three-dimensional object is projected onto a two-dimensional computer screen,
many aspects of the image may be lost for the user's eyes. For example, we will
be working with an object that is displayed by a finite number of straight line
segments, such as the truncated pyramid with hexagonal base. If the vertical
segments of the pyramid located at different three-dimensional faces merge and
collapse in the two-dimensional screen, then an user may get a wrong impression
about the original image.
The
three-dimenional object is defined by a number of vertices:
(x1,y1,z1), (x2,y2,z2),
…, (xn,yn,zn),
and
a number of pairwise line segments connecting the vertices:
(k1—k2), (k2—k3),
…, (km-1—km).
The
truncated pyramid with hexagonal base shown above is defined by n = 12 vertices:
|
P1(1,-0.8,0) |
P2(0.5,-0.8,-0.866) |
P3(-0.5,-0.8,-0.866) |
P4(-1,-0.8,0) |
|
P5(-0.5,-0.8,0.866) |
P6(0.5,-0.8,0.866) |
P7(0.84,-0.4,0) |
P8(0.315,0.125,-0.546) |
|
P9(-0.21,0.65,-0.364) |
P10(-0.36,0.8,0) |
P11(-0.210,0.65,0.364) |
P12(0.315,0.125,0.546) |
and
by m = 18 line segments between the vertices:
|
(P1—P2) |
(P2—P3) |
(P3—P4) |
(P4—P5) |
(P5—P6) |
(P6—P1) |
|
(P7—P8) |
(P8—P9) |
(P9—P10) |
(P10—P11) |
(P11—P12) |
(P12—P7) |
|
(P1—P7) |
(P2—P8) |
(P3—P9) |
(P4—P10) |
(P5—P11) |
(P6—P12) |
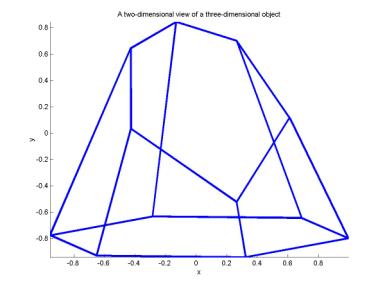
The
two-dimensional screen projection is defined at the plane (x,y) with
z = 0. After the screen projection, the image of the truncated pyramid
with hexagonal base transforms to a set of three polygons shown here:
At
the plane (x,y) with z = 0, 12 vertices of the
pyramid collapse into 8 vertices of the image and 18 line segments of the
pyramid collapse into 10 edges of the three polygons. A better view of the
pyramid on the screen can be achieved by applying different linear
transformations to the vertices (xk,yk,zk),
such as scaling, translation, and rotation. For example, the picture
below represents the truncated pyramid relatively well:
Objectives:
·
develop
three MATLAB functions performing scalings, translations, and rotations at a
given set of vertices of a three-dimensional object
·
understand
effects of scalings, translations, and rotations applied to vertices of a
three-dimensional object
·
develop
a MATLAB function drawing a two-dimensional image of a three-dimensional object
on the computer screen.
·
exploit
linear transformations to find the best view of a given three-dimensional
object on the computer screen.
MATLAB functions performing scalings, translations, and rotations at a given set of vertices
Let
us define a 3-by-n matrix P for a given set of
vertices of a three-dimensional object:
P = 
This
matrix is called the coordinate matrix of the view. The linear
transformations such as scalings, translations, and rotations are applied to
the matrix P.
A 3-by-3
scaling matrix S is defined as
S = 
The
scaling matrix S transforms a unit cube (1,1,1)
into a scaled cube (![]() ,
,![]() ,
,![]() ). The multiplication matrix P' = S*P
transforms vertices of the original picture into vertices of new
picture. Scaling in z is not visible after the projection of the
object onto the plane at z=0.
). The multiplication matrix P' = S*P
transforms vertices of the original picture into vertices of new
picture. Scaling in z is not visible after the projection of the
object onto the plane at z=0.
A 3-by-n
translation matrix T is defined as
T = 
The
sum matrix T + P moves each vertex (xk,yk,zk)
of the original picture into the vertex (xk+x0,yk+y0,zk+z0),
translating the whole picture in the direction of (x0,y0,z0).
Translation in the z-direction is not
visible after the projection of the object onto the plane at z=0.
3-by-3
rotation
matrices Rx,Ry,Rz are defined as
Rx =  , Ry =
  , Rz =
The
matrix Rz rotates the (x,y) plane about
the z-axis at the angle ![]() counter-clockwise.
The matrices Rx and Ry perform
rotations in the (y,z) and (z,x) planes,
respectively. The rotation matrices are orthogonal matrices, i.e. det(Rz)
= 1 and RzT = Rz-1.
The multiplication matrix Rx*Ry*Rz*P
rotates all vertices of the original picture onto the same angles in
the (x,y,z) space.
counter-clockwise.
The matrices Rx and Ry perform
rotations in the (y,z) and (z,x) planes,
respectively. The rotation matrices are orthogonal matrices, i.e. det(Rz)
= 1 and RzT = Rz-1.
The multiplication matrix Rx*Ry*Rz*P
rotates all vertices of the original picture onto the same angles in
the (x,y,z) space.
Steps in writing the MATLAB functions:
- Define the MATLAB
function "Scale" with input parameters [P,
 ,
, ,
, ] and output parameter [P'].
 - Write a short commented description of the function.
- Construct the scaling matrix S and compute P'.
- Define the MATLAB function "Translate" with input parameters [P,x0,y0,z0] and output parameter [P']
- Write a short commented description of the function.
- Construct the translation matrix T and compute P'.
- Define the MATLAB
function "Rotate" with input parameters [P,
 , index] and output parameter [P'].
 - Write a short commented description of the function.
- Construct the rotation
matrix R depending on the index and compute P'.
MATLAB function drawing a two-dimensional image of a three-dimensional object on the computer screen
Let us define a 2-by-m
matrix C for a given set of line segments between the vertices of the
three-dimensional object:
C = ![]()
It
is recommended to use an advanced MATLAB data structure "struct" and
represent C as an array of structures. The
three-dimensional object can be displayed at the computer screen if P
and C are given. The two-dimensional object is displayed as a set
of polygons, where the line segments are connected the vertices at the plane (x,y),
i.e. the object is projected into the plane z = 0.
Steps in writing the MATLAB function:
- Define the MATLAB
function "Draw" with input parameters [P,C] and no output
parameters.
- Project P
into a 2-by-n matrix P2, at the plane z
= 0.
- Loop through columns of
C and draw line segments between the corresponding vertices
of the picture.
- Scale axis, fill the polygons, give a title and labels to the figure.
Exploiting
the MATLAB functions:
- Define P and
C for the truncated pyramid with hexagonal base.
- Draw the pyramid on the
screen by calling the function "Draw".
- Redraw the pyramid
after the scaling transformation with alpha = 1.8, beta
= 0.5, and gamma = 3.
- Redraw the original
pyramid after the translation with x0 = 1.2, y0
= 0.4, and z0 = 1.7.
- Redraw the original
pyramid after rotation about the x-axis with theta =
900.
- Redraw the original
pyramid after rotation about the y-axis with theta =
900.
- Redraw the original
pyramid after rotation about the z-axis with theta =
900
- Redraw the original
pyramid after composite rotations: about the x-axis with theta
= 300, about the y-axis with theta
= -700, about the z-axis with theta
= -270.
QUIZ:
- Draw the truncated pyramid
after the following five transformations:
a)
Scale
the image by a factor of 0.5 in the x-direction, 2
in the y-direction, and 1/3 in the z-direction.
b)
Translate
0.5 unit in the x-direction
c)
Rotate
200 about the x-axis
d)
Rotate
–450 about the y-axis
e)
Rotate
900 about the z-axis.
- Draw the truncated
pyramid after the following seven transformations:
a)
Scale
the image by a factor of 0.3 in the x-direction and
0.5 in the y-direction.
b)
Rotate
450 about the x-axis
c)
Translate
1 unit in the x-direction.
d)
Rotate
350 about the y-axis
e)
Rotate
–450 the z-axis.
f)
Translate
1 unit in the z-direction.
g)
Scale
by a factor of 2 in the x-direction.