LAB 1: DISCRETE MAPS AND NUMERICAL CHAOS
Mathematics:
The
discrete logistic equation takes the form: xk+1 = r xk
(1 – xk), where ![]() xk
xk ![]() is a sequence of
numbers for k = 1,2,3,…,n in the unit interval: xk
is a sequence of
numbers for k = 1,2,3,…,n in the unit interval: xk ![]() (0,1); and r is a bifurcation
parameter: r
(0,1); and r is a bifurcation
parameter: r ![]() (0,4). If x1
(0,4). If x1 ![]() (0,1), then the sequence of xk stays
always in the unit interval, iff r
(0,1), then the sequence of xk stays
always in the unit interval, iff r ![]() (0,4).
(0,4).
Fixed
points x* are defined by the limit: limk
-> ![]() xk = x*.
xk = x*.
For
0 < r < 1, the only fixed point is x* = 0,
and the sequence ![]() xk
xk ![]() converges to x* = 0.
converges to x* = 0.
For
1 < r < 4, there are two fixed points: x*
= 0 and x* = (r-1)/r. When 1 ![]() r
r ![]() 3, the
sequence
3, the
sequence ![]() xk
xk ![]() converges to x*
= (r-1)/r. However, when 3 < r < 4, the sequence
converges to x*
= (r-1)/r. However, when 3 < r < 4, the sequence ![]() xk
xk ![]() converges to 2-periodic,
4-periodic, multi-periodic, and, ultimately, to chaotic sequences of numbers in
the unit interval.
converges to 2-periodic,
4-periodic, multi-periodic, and, ultimately, to chaotic sequences of numbers in
the unit interval.
Numerical
chaos in
mathematical sense was introduced to describe the behavior of deterministic
systems (such as discrete mappings) that generate a random sequence of numbers.
For a chaotic sequence ![]() xk
xk ![]() , a small change in a starting value x1
results in a huge difference in a value xk for large k
> 1, i.e. any error is magnified exponentially. As a result of this
sensitivity to the starting conditions, the detailed long-term behavior of the
deterministic system becomes unpredictable whenever numerical chaos occurs.
, a small change in a starting value x1
results in a huge difference in a value xk for large k
> 1, i.e. any error is magnified exponentially. As a result of this
sensitivity to the starting conditions, the detailed long-term behavior of the
deterministic system becomes unpredictable whenever numerical chaos occurs.
Objectives:
·
visualize
various sequences of numbers ![]() xk
xk ![]() generated from x1
for different values of r
generated from x1
for different values of r
·
construct
a bifurcation diagram displaying various regimes of the discrete map for
different values of r
·
understand
the difference between fixed points, periodic sequences, and chaotic sequences
·
understand
the sensitivity of the chaotic sequences to the starting value x1
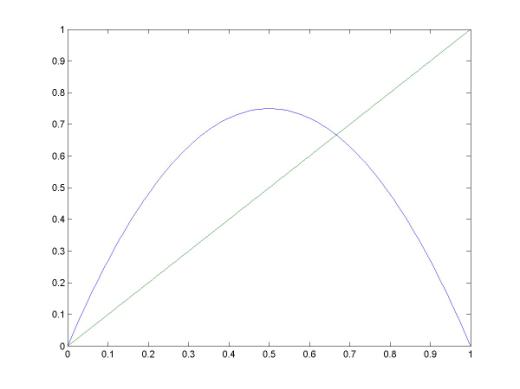
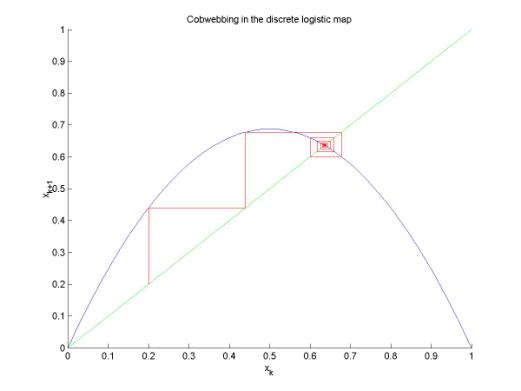
MATLAB script "Cobwebbing pattern for the discrete logistic equation"
A
typical cobwebbing pattern is shown here:
Steps in writing the MATLAB script:
- Initialize a value of parameter r
- Plot the line: xk+1 = xk
- Plot the curve: xk+1 = r*xk*(1-xk) at the same graph
- Initialize a value for x1
- Initialize a number of
elements in a sequence
 xk
xk 
- Compute numbers xk
in a sequence
 xk
xk  and save them
in a vector.
and save them
in a vector. - Plot horizontal and
vertical segments of the cowebbing pattern at the same graph.
Exploiting
the MATLAB script:
- Run the script with r
= 0.5; 1.5; 2.5; 3.25; 3.5; 3.75 and x1 = 0.25;
0.5; 0.75
- Identify fixed-point,
periodic, and chaotic regimes in (1) as the large-k
behaviour of the sequence.
- Check that the
fixed-point and periodic regimes do not depend on the starting value x1
- Run the script with r
= 3.83 and x1=0.5. How many periods does
the sequence have?
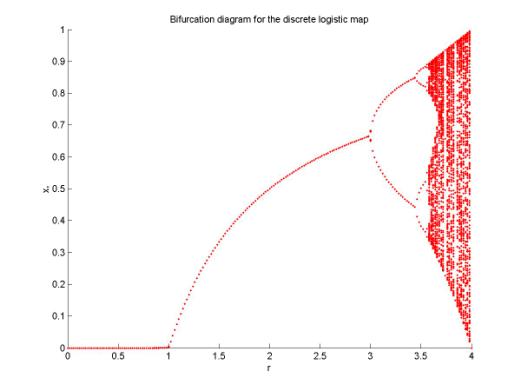
MATLAB script "Bifurcation diagram for the discrete logistic equation"
The
discrete logistic equation exhibits the bifurcation diagram called the
period-doubling route to chaos. The fixed points become unstable and are
replaced by the 2-period, 4-period and other multi-period sequences, with
larger values of the bifurcation parameter r. For yet larger
values of r, the periodic sequences of numbers become unstable
and are replaced by the chaotic sequence of numbers. The period-doubling bifurcation
diagram looks like this:
Steps in writing the MATLAB script:
- Initialize the minimum
and maximum values for an interval of the parameter r.
- Initialize the number
of points in the interval of r
- Loop through the values
of r
- Initialize the starting
value x1 and the number of values xk
in a sequence
- Compute the values xk
in a sequence to settle at a stationary regime
- Continue the sequence xk
in a stationary regime, save the values xk in
a vector
- Plot the values of xk
versus the same value of r on a graph.
Exploiting
the MATLAB script:
- Run the script for 0
< r < 4.
- Zoom the details of the
chaotic regime by running the script for: 3 < r < 4; 3.5 <
r < 4; and for even narrow intervals.
- Find narrow intervals
of r, where there exist 8-periodic and16-period sequences.
- Find stability islands
in the sea of numerical chaos. Check that the sequence may have 3-periods,
5-periods in the stability islands.
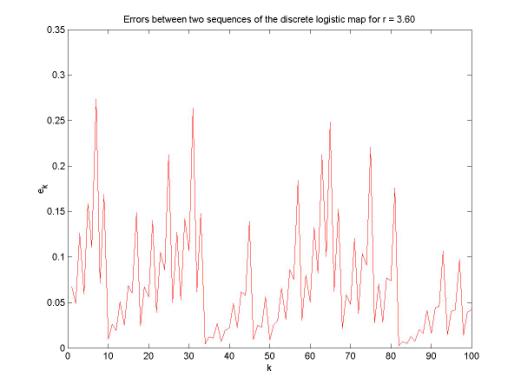
QUIZ: MATLAB script "Sensitivity of chaotic sequences to the starting value"
Suppose
two sequences ![]() xk
xk ![]() and
and ![]() yk
yk ![]() are started with two
values x1 and y1, that are
close in the sense that e1 = | y1 – x1 |
is small. Define an error between the two sequences: ek
= | yk – xk |. If the error converges to zero for
large k, the stationary regime is stable and deterministic, e.g.
a fixed point x* or a periodic sequence
are started with two
values x1 and y1, that are
close in the sense that e1 = | y1 – x1 |
is small. Define an error between the two sequences: ek
= | yk – xk |. If the error converges to zero for
large k, the stationary regime is stable and deterministic, e.g.
a fixed point x* or a periodic sequence ![]() xk
xk ![]() . If the error grows or changes unpredictably (in a unit interval),
the stationary regime is chaotic and the sequence
. If the error grows or changes unpredictably (in a unit interval),
the stationary regime is chaotic and the sequence ![]() xk
xk ![]() is sensitive to the
starting value x1, e.g. at this picture:
is sensitive to the
starting value x1, e.g. at this picture:
Steps in writing the MATLAB script:
- Initialize a value of
the bifurcation parameter r
- Initialize and compute
two sequences
 xk
xk  and
and  yk
yk 
- Compute the error ek
between the two sequences
- Plot the error ek
as function of its index k
Exploiting
the MATLAB script:
Identify whether the stationary regime is
deterministic or chaotic for r = 3.4; 3.6; 3.81; 3.83; 3.85.